


Home-assistant comes with a DSMR reader, but for it to work you need home-assistant installed on the same device that is connected to the DSMR meter. Alternatively, you can use a DSMR reader that send data to MQTT directly. This can be useful if you have home-assistant running on the cloud.
DSMR and LandisGyr+ E350
When you get too crazy about monitoring everything in your house, one of the first things that comes into your mind is probably the energy consumption. In the Netherlands, most of the households have already electricity or gas smart meters that comply with DSMR (Dutch Smart Meter Requirements) standard, which means that in theory you should be able to digitally read the meter.
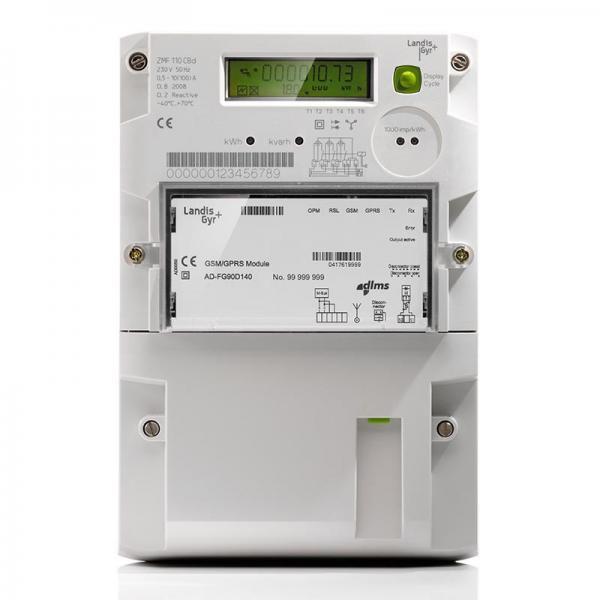
The smart electricity meter that I have at home is LandisGyr+ E350 (DSMR 5 compatible). It comes with a serial port and an optical pulse port as well.
The easiest way to read your consumption is via the serial port using an USB RS232 cable. You can buy them from AliExpress for about 4$. Search for “ftdi ft232r usb ttl 5v to rj11 dsmr p1” or a combination of these words. The cable should look like in the image below with a ftdi rs232 chip in the USB case.

The cable needs a 1K or 2K ohm pull-up resistor soldered between 5v and RXD like in the image below.
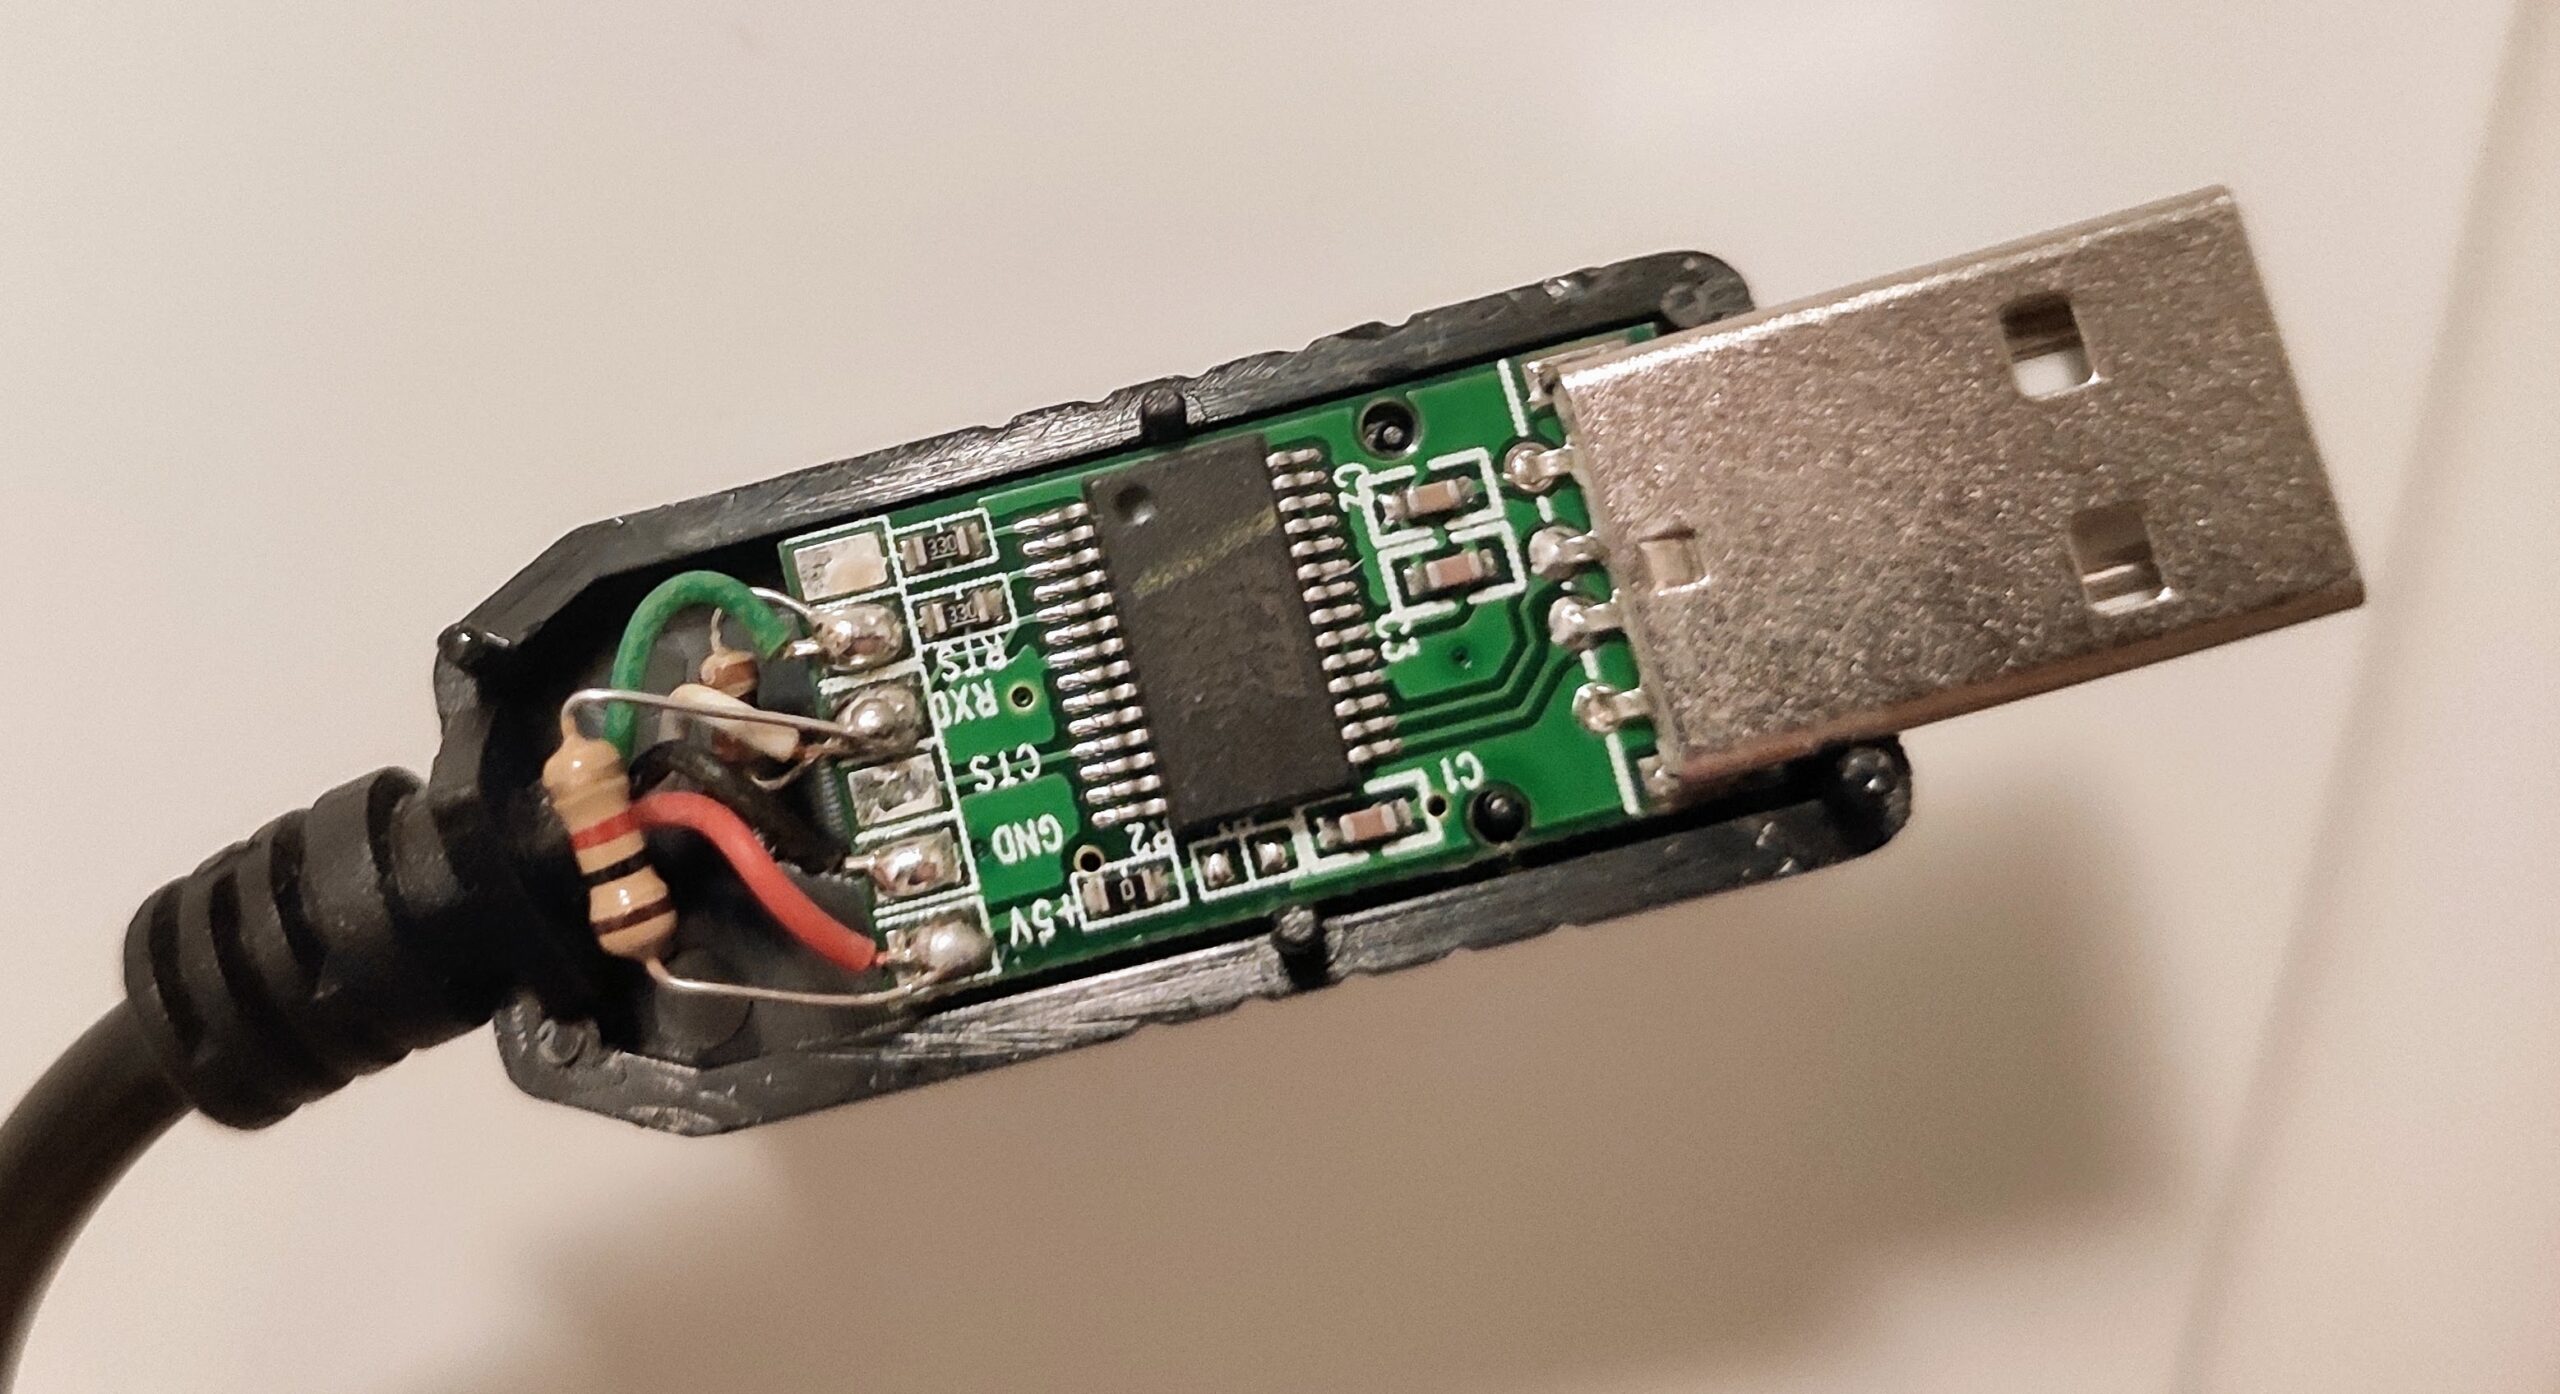
One side of the cable goes into the LandisGyr meter’s RJ11 connector (the green port on the lower side, next to the screws). The other side you connect directly into your RaspberryPi usb. Once connected, you should have /dev/ttyUSB0 available.
Home-assistant DSMR integration
Home-assistant already has a DSMR module, but the reason I am not using it is because my home-assistant runs in the cloud and not on my RaspberryPi. Also, I prefer to keep my sensors data decoupled from home-assistant, so in case HA goes down, my metrics are still logged.
There are two projects I’ve found on github that work on decoding the DSMR telegram.
Python DSMR parser
The project found here is a pure Python parser. I’ve found it quite CPU intensive, especially for my RaspberryPi B+. The package can simply be installed with python pip. (see below my mqtt wrapper)
UPDATE 2024: I switched to this python parser for my RaspberryPi 4 and the latest version is not using that much CPU. It works very well. The C version does not compile anymore.
#!/usr/bin/python3

from dsmr_parser import telegram_specifications
from dsmr_parser.clients import SerialReader, SERIAL_SETTINGS_V5
from dsmr_parser.objects import CosemObject, MBusObject, Telegram
from dsmr_parser.parsers import TelegramParser

import sys
import paho.mqtt.client as mqtt
import time
from lib.mqtt import mqtt

serial_reader = SerialReader(
    device='/dev/ttyUSB0',
    serial_settings=SERIAL_SETTINGS_V5,
    telegram_specification=telegram_specifications.V5
)

mqttc = mqtt()

for telegram in serial_reader.read_as_object():
    #print(telegram)
    mqttc.publish("home/electricity_usage", {
        "value": telegram.CURRENT_ELECTRICITY_USAGE.value,
        "t1": telegram.ELECTRICITY_USED_TARIFF_1.value,
        "t2": telegram.ELECTRICITY_USED_TARIFF_2.value,
        "failures": telegram.SHORT_POWER_FAILURE_COUNT.value
    })
C DSMR parser
The library I’m actually using is from this project. It is written C and it is much more efficient than the Python version. After you compile it, you should have a file called p1-test-p1 that you can just run to decode and print the DSMR telegram.
➜  ~ ./p1-test-p1 /dev/ttyUSB0
Possible telegram found at offset 0
Possible telegram end at offset 863
New-style telegram with length 869
Header: XXXXXXXXXXXXXXXXXX
P1 version: 5.0
Timestamp: 1582142991
Equipment ID: XXXXXXXXXXXXXXXXX
Energy in, tariff 1: 868.963000 kWh
Energy in, tariff 2: 837.711000 kWh
Energy out, tariff 1: 0.000000 kWh
Energy out, tariff 2: 0.000000 kWh
Tariff: 2
Power in: 0.127000 kW
Power out: 0.000000 kW
Power failures: 20
Long power failures: 4
Power failure events: 4
Power failure event end time 1527235604, 580550804 s
Power failure event end time 1528360113, 1124469 s
Power failure event end time 1543593953, 1030 s
Power failure event end time 1543598754, 4778 s
Voltage sags L1: 3
Voltage sags L2: 2
Voltage sags L3: 3
Voltage swells L1: 0
Voltage swells L2: 0
Voltage swells L3: 0
Voltage L1: 238.000000 V
Voltage L2: 236.000000 V
Voltage L3: 237.000000 V
Current L1: 0.000000 A
Current L2: 0.000000 A
Current L3: 0.000000 A
Power in L1: 0.048000 kW
Power in L2: 0.077000 kW
Power in L3: 0.000000 kW
Power out L1: 0.000000 kW
Power out L2: 0.000000 kW
Power out L3: 0.000000 kW
CRC: 0x626f
Parsing successful, data CRC 0x626f, telegram CRC 0x626f
To parse the information and send it to mqtt just pipe the output into a python script that looks like this:
#!/usr/bin/python3

import sys
import paho.mqtt.client as mqtt
from lib.mqtt import mqtt

mqttc = mqtt()

for line in sys.stdin:
    if line.startswith('Energy in, tariff 1: '):
        t1 = float(line.split(' ')[4])
    if line.startswith('Energy in, tariff 2: '):
        t2 = float(line.split(' ')[4])
    if line.startswith('Power in: '):
        instant = float(line.split(' ')[2])
    if line.startswith('Power failures: '):
        failures = int(line.split(' ')[2].strip())
    if line.startswith('Parsing successful'):
        mqttc.publish("home/electricity_usage", {
            "value": instant,
            "t1": t1,
            "t2": t2,
            "failures": failures
        })
And the paho-mqtt wrapper I’ve built to handle connections. Modify line 25 if you are not using websockets.
import paho.mqtt.client as mqttc
import configparser
import os, json
import simplejson

class mqtt(object):
    # set should_loop to False when you subscribe
    def __init__(self, should_loop = True):
        self.mqtt_connect(should_loop)

    def get_conf(self):
        config = configparser.ConfigParser()
        # passwords.ini file
        # [mqtt]
        # user = YourMqttUserName
        # pass = YourPass
        # host = yourhost/ip
        # port = mqttPort
        # timeout = timeout-seconds
        config.read(os.path.dirname(os.path.abspath(__file__)) + '/../passwords.ini')
        return config

    def mqtt_connect(self, should_loop):
        c = self.get_conf()
        self.mqtt_client = mqttc.Client(transport='websockets')
        self.mqtt_client.tls_set()
        self.mqtt_client.username_pw_set(c['mqtt']['user'], c['mqtt']['pass'])
        if should_loop:
            self.mqtt_client.connect(c['mqtt']['host'], int(c['mqtt']['port']), int(c['mqtt']['timeout']))
            self.mqtt_client.loop_start()

    def publish(self, topic, value, qos=1, retain=False):
        if type(value) == dict:
           value = simplejson.dumps(value)
        self.mqtt_client.publish(topic, value, qos, retain).wait_for_publish()

    def on_connect_subscribe(self, client, userdata, flags, rc):
        self.mqtt_client.subscribe(self._topic)

    def subscribe(self, topic, callback):
        c = self.get_conf()
        self._topic = topic

        self.mqtt_client.on_message = callback
        self.mqtt_client.on_connect = self.on_connect_subscribe
        self.mqtt_client.connect(c['mqtt']['host'], int(c['mqtt']['port']), int(c['mqtt']['timeout']))

        self.mqtt_client.loop_forever(timeout=60)
You can now create a bash script to run this continuously. I recommend you to run it with supervisord to automatically restart it if it crashes.
#!/bin/bash
cd $(dirname $0)
./p1-test-p1 /dev/ttyUSB0 | ./dsmr.py
The supervisord file /etc/supervisor/conf.d/electricity.conf
[program:electricity]
user=pi
command=/home/pi/dsmr.sh
directory=/home/pi
stdout_logfile=/var/log/el.log
stderr_logfile=/var/log/el.log.err
autorestart=true
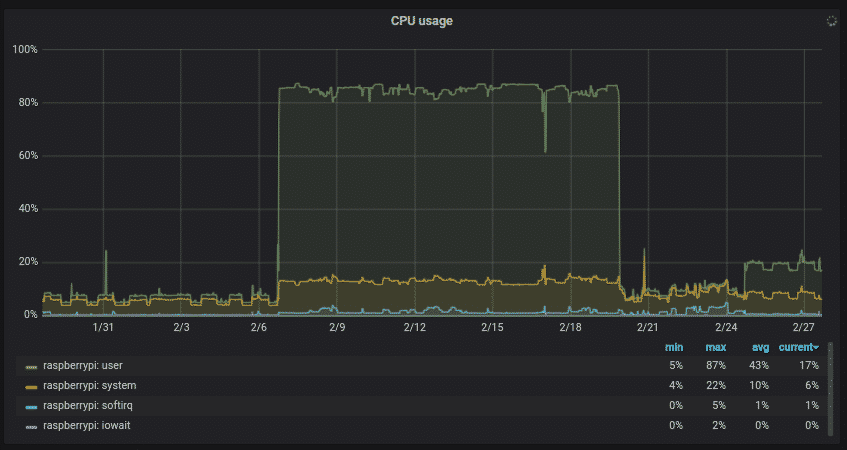
You can see in this dashboard the CPU usage comparison between the two implementations. The C implementation clearly wins at performance, which is extremely important when dealing with limited resources.
DSMR to InfluxDB, Home-Assistant and Grafana
Once you have all the data sent to MQTT every second, you can now show it in home assistant, save it in InfluxDB and display historical data in Grafana.
MQTT to InfluxDB
To send the data from MQTT to InfluxDb I’m using telegraf with the following configuration:
[[inputs.mqtt_consumer]]
    servers = ["tcp://localhost:1883"]
    qos = 2
    # connection_timeout = "30s"
    # max_undelivered_messages = 1000

    topics = [
      "home/electricity_usage"
    ]
    persistent_session = true

    client_id = "electricity_usage"
    username = "YOUR-USERNAME"
    password = "YOUR-PASSWORD"
    data_format = "json"
    name_override = "electricity_usage"
Home-Assistant configuration
The configuration for home-assistant is simple. We are just going to create mqtt sensors like this:
- platform: mqtt
  state_topic: "home/electricity_usage"
  name: "Current consumption"
  icon: 'mdi:flash'
  expire_after: 30
  unit_of_measurement: "kW"
  value_template: "{{ value_json['value'] }}"

- platform: mqtt
  state_topic: "home/electricity_usage"
  name: "Electricity usage T1"
  icon: 'mdi:power-plug'
  expire_after: 30
  unit_of_measurement: "kWh"
  value_template: "{{ value_json['t1'] }}"

- platform: mqtt
  state_topic: "home/electricity_usage"
  name: "Electricity usage T2"
  icon: 'mdi:power-plug'
  expire_after: 30
  unit_of_measurement: "kWh"
  value_template: "{{ value_json['t2'] }}"

- platform: mqtt
  state_topic: "home/electricity_usage"
  name: "Power failures"
  icon: 'mdi:flash-off'
  expire_after: 30
  unit_of_measurement: ""
  value_template: "{{ value_json['failures'] }}"
And the panel looks like this:
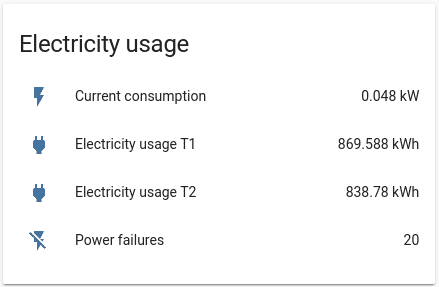
However, having the meter counter doesn’t mean much, but having the usage over periods of time is more useful. For this we need to create InfluxDb sensors in home assistant sensors.yaml file.
- platform: influxdb
  host: INFLUXDB_HOST
  port: INFLUXDB_PORT
  ssl: true
  verify_ssl: true
  username: !secret influxdb_user
  password: !secret influxdb_pass
  queries:
    - name: electricity_last_30d
      unit_of_measurement: kWh
      value_template: '{{ value | round() }}'
      group_function: ' '
      where: 'time > now() - 30d'
      measurement: '"electricity_usage"'
      field: 'last("t1")+last("t2")-first("t1")-first("t2")'
      database: telegraf
    - name: electricity_last_7d
      unit_of_measurement: kWh
      value_template: '{{ value | round() }}'
      group_function: ' '
      where: 'time > now() - 7d'
      measurement: '"electricity_usage"'
      field: 'last("t1")+last("t2")-first("t1")-first("t2")'
      database: telegraf
    - name: electricity_last_24h
      unit_of_measurement: kWh
      value_template: '{{ value | round(1) }}'
      group_function: ' '
      where: 'time > now() - 24h'
      measurement: '"electricity_usage"'
      field: 'last("t1")+last("t2")-first("t1")-first("t2")'
      database: telegraf
    - name: electricity_last_1h
      unit_of_measurement: kWh
      value_template: '{{ value | round(2) }}'
      group_function: ' '
      where: 'time > now() - 1h'
      measurement: '"electricity_usage"'
      field: 'last("t1")+last("t2")-first("t1")-first("t2")'
      database: telegraf
And the new panel:

Power usage in Grafana
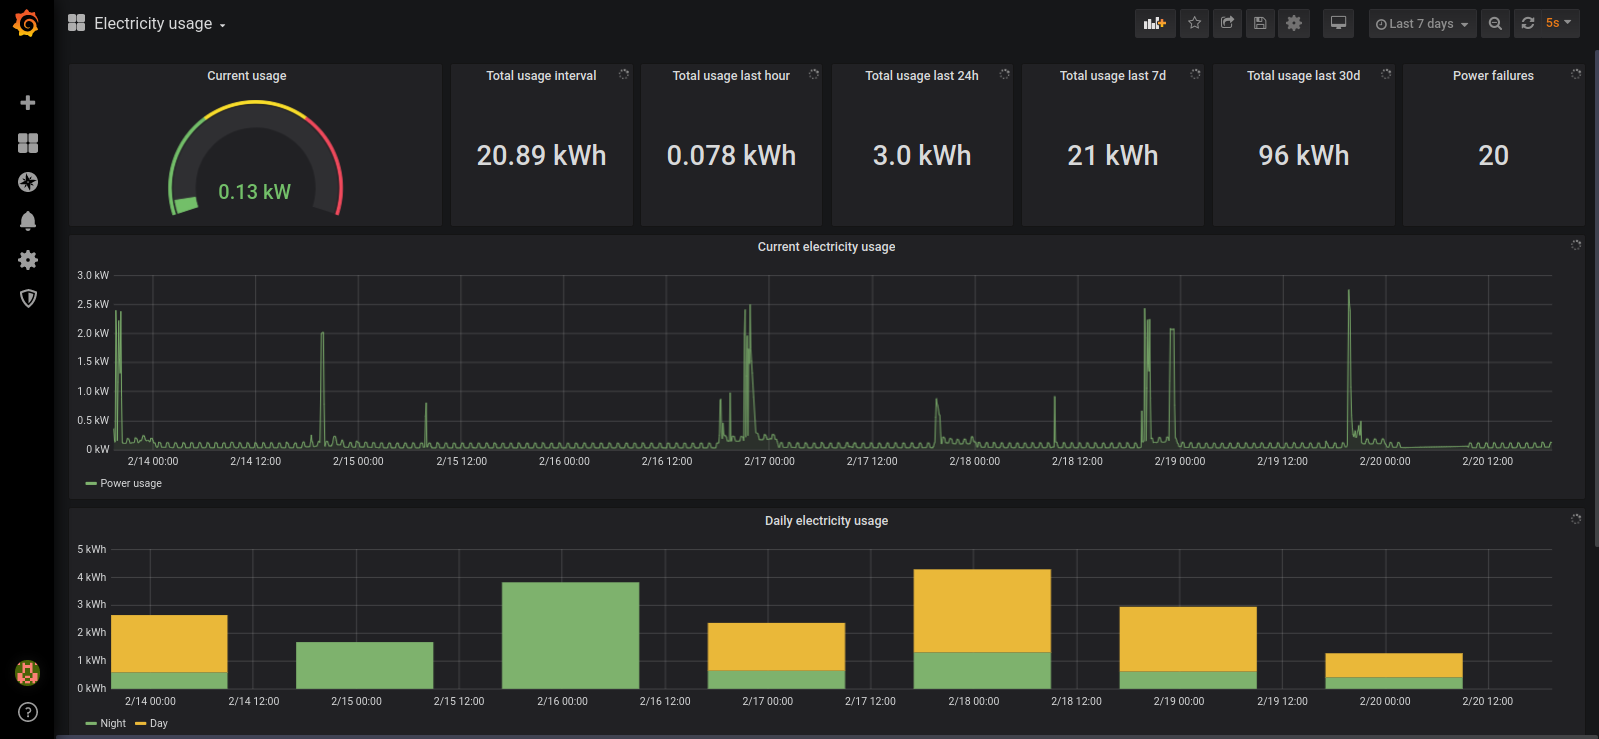
For historical data, I am using Grafana backed by InfluxDb. It has a much better interface than home assistant and I can also set up there my own alerts, for example when power usage goes above a limit or if there is no sensor data coming in.
And here is my dashboard. You can find the json here
1 thought on “DSMR reader for home-assistant using MQTT”